Episode 469

October 27, 2026

00:18:17

469: What the shape of a face reveals about cleft risk

Hosted by

Gustavo B Barra
469: What the shape of a face reveals about cleft risk
Base by Base
469: What the shape of a face reveals about cleft risk

Oct 27 2026 | 00:18:17

/

Show Notes

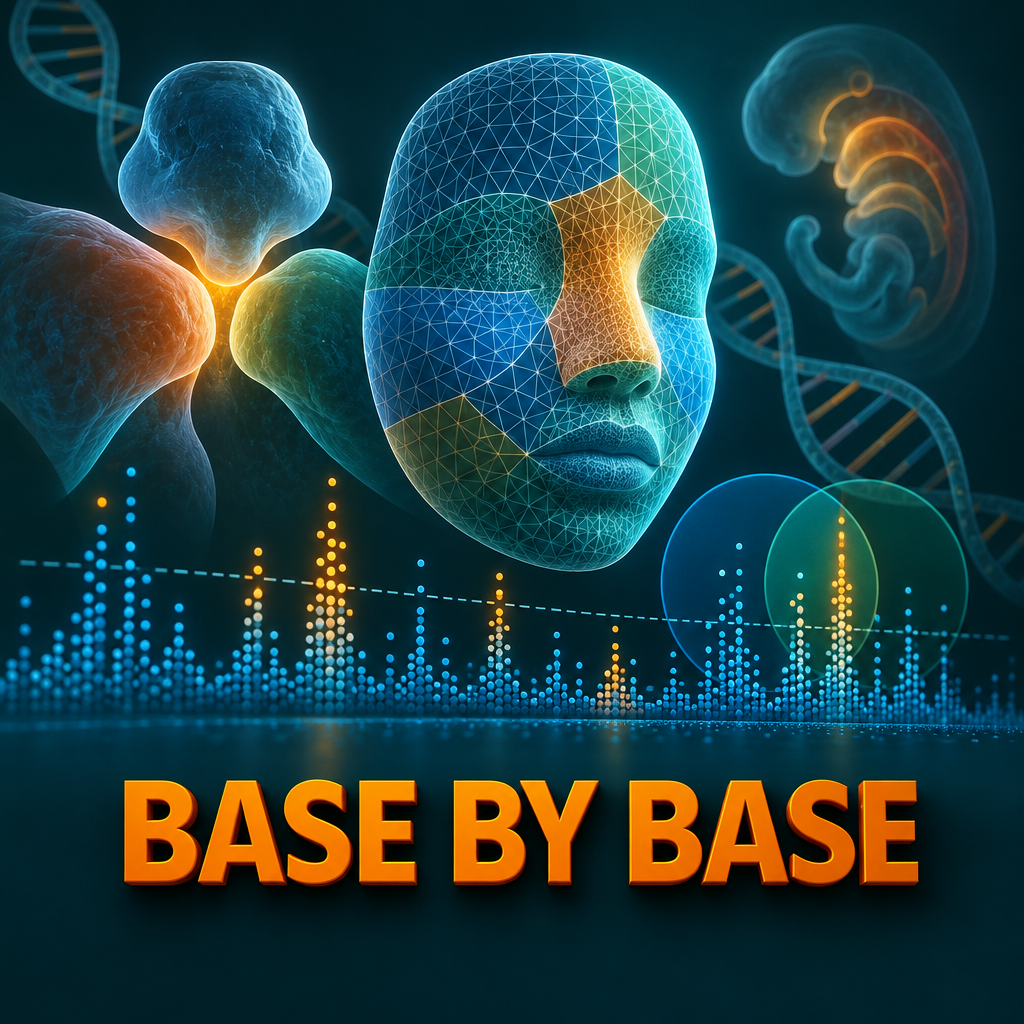
Herrick N et al., Human Genetics and Genomics Advances - Orofacial clefts are among the most common birth defects, affecting about 1 in 700 births, yet known genetic signals explain only a fraction of their heritability, and cleft studies cannot reach the huge sample sizes used for traits like height. This study borrowed statistical power from a related trait: the genetics of normal human face shape. Using a pleiotropy-informed method called conditional false discovery rate, the team re-analyzed an existing GWAS of nonsyndromic cleft lip with or without cleft palate and found new candidate risk loci, three of which passed a 5% FDR threshold in an independent replication cohort. Key terms: orofacial cleft, facial shape, GWAS, conditional false discovery rate, pleiotropy.

Study Highlights:
The team conditioned summary statistics from a European nsCL/P GWAS of 3,969 individuals on two independent facial shape GWASs, from 4,680 US and 3,566 UK individuals. SNPs associated with nsCL/P were enriched among SNPs associated with facial shape but not among those for unrelated traits such as height, schizophrenia or LDL cholesterol. The cFDR approach identified 21 independent loci at a 5% threshold and 15 more at 10%, and the new loci had effect sizes comparable to known ones, with no significant difference in a Mann-Whitney U test (p = 0.26). Of 13 new lead SNPs tested in The Cleft Collective cohort of 1,084 affected individuals and 7,913 controls, five replicated at p < 0.05, and loci near MSX2, ASPSCR1 and FHOD3 passed a 5% FDR threshold. Spatial transcriptomics of a Carnegie stage 13 human embryo showed expression and gene specificity scores for these genes in the pharyngeal arches, among other regions.

Conclusion:
Leveraging the shared genetics of face shape and clefting can recover cleft risk loci that a standard GWAS of the same data misses, and it supports the long-standing idea that embryonic face shape is itself part of cleft risk. The analysis is limited to people of European ancestry, the authors expect about 10% of the 36 loci to be false positives, not every new locus replicated, and the expression data support but do not prove a role for the candidate genes.

Article title:
Leveraging the genetics of human face shape boosts the discovery of orofacial cleft risk loci

First author:
Herrick N

Journal:
Human Genetics and Genomics Advances

DOI:
10.1016/j.xhgg.2026.100655

Reference:
Herrick N., Goovaerts S., Manchel A., Lee M.K., Zhang X., Davies A., et al. Leveraging the genetics of human face shape boosts the discovery of orofacial cleft risk loci. Human Genetics and Genomics Advances, 7, 100655. (2026). https://doi.org/10.1016/j.xhgg.2026.100655

License:
This episode is based on an open-access article published under the Creative Commons Attribution 4.0 International License (CC BY 4.0) – https://creativecommons.org/licenses/by/4.0/

Support:
Base by Base is independent and ad-free — no sponsors, no paywall. If an episode was worth your time, chip in and keep the papers audited and the original songs coming:
❤️ Support monthly: https://buy.stripe.com/cNifZhclVebvagk2JDgEg01
☕ One-time donation: https://donate.stripe.com/7sY4gz71B2sN3RWac5gEg00
▶️ Watch with chapters on YouTube: https://www.youtube.com/@basebybase
More at basebybase.com

On PaperCast Base by Base you'll discover the latest in genomics, functional genomics, structural genomics, and proteomics.

Episode link: https://basebybase.com/episodes/face-shape-genetics-orofacial-cleft-risk-loci

QC:
This episode was checked against the original article PDF and publication metadata for the episode release published on 2026-10-27.

QC Scope:
- article metadata and core scientific claims from the narration
- excludes analogies, intro/outro, and music
- transcript coverage: All scientific content: cleft burden and missing heritability, the face shape hypothesis, cFDR method and cohorts, enrichment vs control traits, 36 loci, cohort overlap, effect sizes, replication, regional plots, CS13 expression and gsMap, gene discussion, limitations.
- transcript topics: Orofacial cleft incidence and missing heritability; Embryonic face shape as a cleft risk factor; Conditional false discovery rate GWAS design; Enrichment of nsCL/P SNPs in facial shape vs unrelated traits; 21 loci at 5% cFDR and 15 at 10% cFDR; Effect sizes of known vs new loci

QC Summary:
- factual score: 10/10
- metadata score: 10/10
- supported core claims: 8
- claims flagged for review: 0
- metadata checks passed: 4
- metadata issues found: 0

Metadata Audited:
- article_doi
- article_title
- article_journal
- license

Factual Items Audited:
- Incidence about 1/700 live births and over 50 known loci
- Facial GWAS of 4,680 US and 3,566 UK individuals; nsCL/P subset of 3,969
- Enrichment for facial shape but not seven unrelated traits
- 21 loci at 5% and 15 at 10% cFDR; original GWAS 10 plus 2 signals; 24 relied on face
- 55%, 86% and 13% cohort overlap
- Effect sizes above 0.2, means 0.31 and 0.35, p = 0.26

QC result: Pass.

Chapters

  • (00:00:03) - Introduction: Face Shape and Clefts
  • (00:01:21) - The Study and Researchers
  • (00:02:18) - Background on Orofacial Clefts
  • (00:03:28) - The Face-Cleft Genetic Link Hypothesis
  • (00:04:46) - The CFDR Method Explained
  • (00:05:21) - Study Data and Controls
  • (00:07:01) - Analysis Details and Validation Approach
  • (00:07:41) - Results: Face Shape as a Predictive Map
  • (00:08:17) - Main Findings: New Cleft Loci Discovered
  • (00:08:49) - Comparing US and UK Cohorts
  • (00:09:23) - Are New Loci Real? Effect Size Check
  • (00:09:56) - Replication in the Cleft Collective Cohort
  • (00:11:06) - Regional Plots of Three Candidate Genes
  • (00:11:36) - Gene Expression in the Embryo
  • (00:12:41) - Spatial Genetic Risk Mapping (GSMap)
  • (00:13:17) - MSX2: A Known Suspect Confirmed
  • (00:13:53) - ASPSCR1 and FHOD3: New Biological Clues
  • (00:15:05) - Bigger Picture: Shared Genetic Architecture
  • (00:16:10) - Limitations of the Study
  • (00:16:48) - Conclusions and Closing Thoughts

View Full Transcript

Episode Transcript

[00:00:03] Picture a face in the earliest weeks of life, long before it looks like a face, a few soft swellings of tissue grow toward each other, like puzzle pieces sliding across a table. If they meet and fuse on time, the upper lip and the roof of the mouth close. [00:00:21] If they miss even slightly, A child is born with a cleft and now ask could the ordinary shape of your face carry clues about the genes that make those pieces meet? [00:00:39] This is base by base. Every episode is built with AI tools from a real open access paper curated by a human, and every claim is checked against the paper before we publish. You'll find this episode's fact check score on our website. [00:00:52] Now back to the story. [00:00:59] Here is a way to picture today's idea. Imagine walking a beach with a metal detector. It beeps faintly in dozens of places, and you cannot dig them all. Then someone hands you an old map showing where people once lived along that shore. Suddenly, some faint beeps matter more because they sit right where the map says treasure is likely. [00:01:21] Today's story is about researchers who used the genetics of normal face shape as that map. They were looking for hidden genetic risk for cleft lip and palate. [00:01:36] Today we celebrate the work of Noah Herrick, Seth Weinberg, John Schaefer, Peter Claes and colleagues from the University of Pittsburgh, KU Leuven, the Children's Hospital of Philadelphia, the University of Bristol, Emory University, the University of North Carolina at Chapel Hill, and the Murdoch Children's Research Institute, who have advanced our understanding of the genetics of orofacial clefts. Their paper, Leveraging the Genetics of Human Face Boosts the Discovery of Orofacial cleft riscloci was published in Human Genetics and Genomics advances in October 2026. [00:02:18] Let's start with the condition. Orofacial clefts are among the most common birth defects in humans. The average global incidence is estimated at about 1 in 700 live births. Most cases appear on their own without other malformations. [00:02:34] Children usually need several surgeries and years of care from many specialists, and clefts are linked with health effects that can last across life. [00:02:43] Yet the causes remain poorly understood because clefts arise from many genetic and environmental factors acting together. [00:02:53] Genome scans have already found over 50 regions of the genome associated with different forms of non syndromic clefts, but together these explain only a fraction of the heritability. [00:03:05] Many risk variants are probably still hidden, especially those with small effects or effects that depend on the environment. [00:03:12] For traits like height or blood pressure, the usual answer is simply more people, hundreds of thousands of them For a birth defect, that kind of sample is just not possible. [00:03:23] So the team needed a smarter way to look. [00:03:28] Their idea rests on a link that is older than mine. Modern genetics since the 1960s, researchers have proposed that the shape of the embryonic face is itself a risk factor for clefting. If the growing tissue masses sit in slightly different positions or grow in slightly different shapes, they may struggle to meet and fuse. And there is supporting evidence mouse strains at high risk of clefting have differently shaped faces as embryos and as adults. [00:03:58] And parents and siblings of people with clefts show facial shape differences too. [00:04:05] Genetics points the same way. Since 2012, studies in different populations have found over 300 regions affecting human facial features. Genes near face shape signals are enriched for biological processes linked to clefting. Known cleft risk variants have measurable effects on on normal facial shape. In earlier work, this team measured a subtle facial pattern in 3D photos of unaffected parents of children with clefts. Then they found 29 genetic variants associated with it. They sat in the philtrum, the nose, the jaw and the upper face. [00:04:46] So here is the plan. The team used a method called the Conditional False Discovery Rate or cfdr. A standard genome wide association study is called a gwas. [00:04:58] It tests millions of genetic variants one by one for a link with a single trait. The CFDR approach asks a slightly different if a variant is linked to a related trait, how likely is its link to the target trait to be real? It is an empirical Bayesian idea. Prior evidence from one trait raises or lowers your confidence in the other. [00:05:21] The target trait was non syndromic cleft lip with or without cleft palate. It is the most common type of cleft. The cleft data came from the team's large 2017 genome wide meta analysis. The results were recalculated in a subset of 3,969 individual individuals of recent European genetic ancestry. [00:05:44] Importantly, no new genotyping was needed. Everything ran on summary statistics the published results of earlier studies. [00:05:54] The map in our beach picture came from the team's 2021 face shape study. It had 4,680 individuals from the United States and 3,566 from the United Kingdom. [00:06:07] Their 3D facial surfaces were divided into 63 segments. [00:06:12] That study found 203 distinct signals at 138 loci. Here the team used the whole face analysis and they ran the United States and United Kingdom cohort separately to compare the results. [00:06:28] There was an obvious maybe conditioning on any large trait would be boost discovery face or not so. The team also tested seven unrelated traits. Schizophrenia, heel, bone mineral density and LDL cholesterol, inflammatory bowel disease, Alzheimer's disease, height and chronic kidney disease. These act as controls. If face shape is special, it should outperform them. In our beach picture. Does a map of random streets work as well as a map of old settlements? [00:07:01] A few more details. The main discovery threshold was a CFDR below 5% with 10% as a secondary suggestive threshold. [00:07:10] Regions with complex patterns of linked variants were excluded and models were built over 500 rounds of randomly pruned variant sets. [00:07:20] Signals within 250 kilobases of each other were merged into a single single locus. Then any new locus was checked in a separate group, the cleft collective. It had 1,084 affected individuals and 7,913 controls. [00:07:41] So what did they find? [00:07:43] First, the test of the map itself. The team compared how often variants with a hint of association to clefs also showed a hint of association to each other trait for face shape. Cleft associated variants were clearly enriched for the seven unrelated traits. They were not. And as the enrichment rose, so did the genetic correlation with clefts, starting low for the unrelated traits and climbing toward face shape. So the map was not random. Face shape and clefts share part of their genetic architecture. [00:08:17] Then the main result with face shape as prior evidence. The CFDR approach identified 21 independent cleft loci at the 5% threshold. It found 15 more at 10%, 36 loci in total. [00:08:33] For comparison, the original cleft study alone with standard corrections gave 10 signals at 5%. It gave two more at 10%. So 24. Four of the signals relied on leveraging the genetics of facial variation. [00:08:49] How did the two phase cohorts compare? [00:08:53] The majority of lead variants, 55% were found using both the United States and the United Kingdom data. But the overlap depended on the threshold. At 5%, 86% were shared, while at 10% only 13% were shared among the 21 strict hits. The five signals from the original cleft study were all recovered. Nine more had been implicated in other cleft studies and seven were new regions for this type of cleft. [00:09:23] Now a fair worry were the new loci just weak signals pulled up by a looser rule. The team compared effect sizes. All lead variants had effect sizes greater than 0.2. The average was 0.31 for known loci and 0.35 for new ones. The difference was not significant with a p value of 0.26 in our beach picture. The new finds were not bottle caps. They were about as heavy as the coins already found. [00:09:56] And did the new loci hold up in other people? [00:10:00] To validate the 14 new loci, the the team looked them up. In the cleft collective cohort, 13 lead variants were available for testing and five replicated at the nominal P value below 0.05. [00:10:13] Not every new locus replicated, but that is more than expected by chance alone. Applying a stricter 5% false discovery rate in the replication, three loci passed, they point to three candidate MSX2, ASPSC and FHOD3. [00:10:33] For these three, the direction matched too. The variants that raised risk in the discovery data also raised it in the replication data. And the protective ones stayed protective. And here is the key point. In the original cleft study alone, none of these three would have passed a 5% false discovery rate. The adjusted P value was 0.4 for MSX2. It was 0.24 for both ASP, SCR1 and FHOD3. Without the face map, these beeps stayed buried. [00:11:06] The team then plotted each of the three regions in three the new face informed analysis, the original cleft study and the original face shape study. These regional plots show the lead variant, the neighboring variants linked to it, and the thresholds for significant and suggestive findings. [00:11:25] Put another way, a modest cleft signal and a face shape signal sit at the same spot in the genome. Together they make a clearer finding. [00:11:36] Next, where are these genes active in the embryo? The team turned to an atlas of human craniofacial development. [00:11:43] It combines single nucleus R RNA sequencing with spatial maps of gene activity. They looked at an early embryo at Carnegie stage 13. [00:11:52] Each gene had its own pattern. MSX2 showed localized high expression in several regions. These included the pharyngeal arches, the heart and the trunk neural crest. Similar to the known cleft gene PAX7, ASPSCR1 was explained expressed in every cell cluster. That pattern resembles another known cleft gene, TANC2, but is more widespread. And FHOD3 was expressed mainly in the heart cluster. It showed traces in the forebrain, the craniofacial ectoderm and the trunk neural crest. So three genes, three very different maps of activity. In our beach picture, the coins were found in different parts of the old settlement. [00:12:41] Finally, the team used a method called GS map, which projects genetic risk onto spatial maps of tissue. [00:12:48] With the full cleft summary statistics, the overall genetic risk for clefts lit up in the pharyngeal arches. In one view, the nasal region lit up too. [00:12:58] The scores for all three genes were also enriched in the pharyngeal arch. [00:13:03] For Fhod3 and Asps CR1, the facial region was enriched too. These are exactly the tissues that build the face. [00:13:17] What does this mean for each gene? MSX2 was already a suspect for clefts but had never reached genome wide significance. It is well known for its link with Boston type craniosynostosis, a condition where skull bones fuse too early. [00:13:32] An earlier Suggestive hit near MSX2 involved variants in a long non coding RNA, but they are not linked to this study's lead variant. They sit 250 kilobases or more away. [00:13:45] The new finding fits a pattern of shared genetic risk across craniofacial conditions. [00:13:53] ASPSCR1 on chromosome 17 encodes a protein that interacts with glucose transporter type 4 that sounds far from the face. But recent work showed that cranial neural crest cells need proper glucose uptake to build the midface. Disrupting it can lead to midline facial clefts. The authors are careful here. Direct Mechanistic links for ASPSCR1.1 remain unclear and FHOD3 is a known disease gene in hypertrophic cardiomyopathy, a thickening of the heart muscle. [00:14:31] That heart connection is intriguing. Congenital heart defects are more common in people with orofacial clefts than in the general population. [00:14:40] The incidence rate is approximately 15%, so FHOD3 may hint at a shared pathway between the face and the heart. [00:14:49] More broadly, signals in the trunk neural crest suggest these genes may take part in wider developmental programs. Those programs are shared across neural crest cells, the migrating cells that build much of the face. [00:15:05] Step back and the bigger picture comes into focus. [00:15:08] The results add strong support to the lungs long standing idea that face shape and clefting are driven by a partly shared genetic architecture. The authors raise an open could some of these genes form a shape driven pathway, a polygenic background that nudges a person toward or away from the threshold for a cleft? [00:15:29] Earlier work has shown that such a background can modify how often rare damaging mutations actually lead to a cleft. [00:15:40] And the method travels at a comparable suggestive threshold. The original cleft study found only 11 of the 36 loci. It used the very same cleft data. Nothing new was sequenced. The gain came entirely from borrowing strength from a related trait. For birth defects, where huge samples are simply not possible. This approach may find risk genes that that standard gene mapping misses, and it may help with other structural birth defects too. [00:16:10] Now the limits all the data came from individuals of recent European genetic ancestry, so the findings may not carry over to other populations. Across the 36 loci, the authors themselves expect about 10% about 4 loci to be false positives. Not every new locus replicates located in the independent cohort. The candidate genes were assigned by position and the expression maps support but do not prove a role in clefting, and the biology linking ASPSCR1 and fhod3 to the face is still unclear. [00:16:48] So here is where this leaves us. Cleft studies are too small to find every risk gene on their own. [00:16:55] Using the genetics of normal face shape as prior evidence, this team found 36 cleft loci. Many were invisible to the original analysis, and the new ones had effects comparable to known ones. 3. Near MSX2, ASPSCR1 and FHOD3 held up in an independent cohort, and they are active in the tissues that build the face. [00:17:20] Remember the metal detector on the beach? The faint beeps were always there. What changed was the map, the genetics of the faces we see every day? [00:17:31] If an ordinary face can point to hidden risk for a birth defect, what other traits might help us find the genes we are still missing? [00:17:45] This episode was based on an open Open Access article under the CC BY 4.0 license. You can find a direct link to the paper and the license in our episode. Description if you enjoyed this, follow or subscribe in your podcast app and leave a five star rating. If you'd like to support our work, use the donation link in the description. Thanks for listening and join us next time as we explore more science base by base.

Other Episodes